


If you are still reliant on Excel or Google Sheets to forecast your inventory, here’s a piece of good news: you can automate much of the process without completely changing how your team plans inventory.
For small and medium-sized businesses, you want to eliminate repetitive forecasting work so your planners can spend more time making decisions.
This guide explains how to move from manual inventory forecasting to an automated inventory planning process, including how to set up critical SKUs and how inventory forecasting tool like StockTrim eases into your workflow.
Key Takeaway
Moving from manual forecasting to automated inventory planning is a process improvement project that involves these steps:
-
Document your current forecasting process.
-
Clean and consolidate your inventory data.
-
Choose an inventory forecasting tool that fits your business.
-
Connect your existing business systems.
-
Identify and configure your critical SKUs.
-
Set planning parameters such as lead times and safety stock.
-
Run automated forecasts alongside your manual process.
-
Move toward exception-based inventory planning.
-
If you’re a manufacturer, extend forecasting to components and raw materials.
-
Measure results and continuously refine the process.
It’s recommended to start small, validate the results, and expand automation as your team gains confidence in the system.
Why Should SMBs Automate Manual Inventory Forecasting?
Manual forecasting works well enough when a business has a small number of SKUs and relatively stable demand.
However, this process becomes much harder to maintain as the business grows.
For instance, a demand planner may need to:
- Export sales history
- Clean and consolidate data
- Calculate historical averages
- Adjust forecasts manually
- Check current inventory
- Review open purchase orders
- Calculate safety stock
- Check supplier lead times
- Identify potential stock-outs
- Calculate reorder quantities
- Build purchase recommendations
When this happens every week across hundreds or thousands of SKUs, much of the planner's time is spent preparing the forecast rather than using it to predict future demand.
Automating these repetitive calculations can make the planning process faster, more consistent and of course, easier to scale.
It can also help reduce the risk of spreadsheet errors and ensure that forecasts are based on the latest available inventory and sales information.
Step 1: Document How You Forecast Today
Before choosing a forecasting software, map out your existing process.
Ask:
- Where does our sales data come from?
- Where is inventory data stored?
- How frequently is the data updated?
- How do we calculate demand?
- How do we account for seasonality?
- How do we calculate safety stock?
- How do we decide when to reorder?
- Which steps require manual intervention?
- Which decisions depend on planner judgement?
For example, your current workflow might look like:
Export sales → update spreadsheet → calculate forecast → check stock → check lead times → calculate reorder quantity → create purchase recommendations.
This exercise helps you identify which parts of the process should be automated.
What should you automate?
Generally, automate activities that are:
- Repetitive
- Rules-based
- Data-intensive
- Time-consuming
- Performed frequently
- Prone to spreadsheet errors
Keep human judgement for decisions involving information that may not exist in historical data, such as major promotions, new product launches or unexpected market changes.
Step 2: Clean Your Inventory and Sales Data
Automated forecasting is only as useful as the data going into it.
Before implementing a forecasting tool, review your:
- SKU numbers
- Product descriptions
- Historical sales
- Current inventory
- Open purchase orders
- Supplier information
- Supplier lead times
- Minimum order quantities
- Order multiples
- Returns
- Stock adjustments
- Product status
Pay particular attention to stock-outs.
If a product was unavailable for several weeks, its historical sales may show very low demand. That does not necessarily mean customers did not want the product.
It may simply mean you had nothing to sell.
Clean data helps the forecasting system distinguish between actual changes in demand and events that distorted your sales history.
You don't need a perfect dataset before getting started. But you should understand the major anomalies in your historical data and make sure the system has the core information required for inventory planning.
Step 3: Choose Inventory Forecasting Software
The next step is choosing a tool that can automate the forecasting activities you currently perform manually.
Inventory management software primarily helps you understand what you have.
Inventory forecasting software helps you estimate what you are likely to need. It can go a step further by using the forecast, current stock, lead times and other constraints to recommend what you should replenish and when.
When evaluating forecasting software for an SMB, consider whether it can:
- Automatically generate SKU-level forecasts
- Use historical sales data
- Account for seasonality and demand patterns
- Calculate safety stock
- Consider supplier lead times
- Generate replenishment recommendations
- Connect to your existing business systems
- Handle large SKU counts
- Support multiple locations or sales channels
- Support manufacturing and BOM forecasting, if relevant
- Highlight exceptions rather than requiring manual review of every SKU
Also consider implementation time.
For many SMBs, a forecasting solution needs to be practical enough for an existing operations or supply chain team to manage without a dedicated data science department.
Step 4: Connect Your Existing Systems
Once you've selected a forecasting tool, connect it to the systems that contain your operational data.
Depending on your business, this could include an:
- ERP
- Inventory management system
- Accounting platform
- E-commerce platform
- POS system
- Warehouse management system
- Spreadsheet
The goal is to remove the repetitive process of exporting, formatting and uploading data every forecasting cycle.
Step 5: Identify Your Critical SKUs
One of the most important steps when implementing automated forecasting is deciding which products deserve the most attention.
You don't necessarily need to start by configuring every SKU.
Instead, identify your critical SKUs first.
A critical SKU is a product or component where inaccurate forecasting or poor availability could have a significant impact on your business.
These could include:
- High-revenue products
- Fast-moving products
- High-margin products
- Frequently stocked-out products
- Products with long supplier lead times
- Difficult-to-replenish products
- Products with important customer commitments
- Components that can halt production
Use ABC analysis as a starting point
A items are typically your highest-impact products and deserve the closest attention.
B items have moderate business impact.
C items have relatively low impact and can often be managed using simpler inventory rules.
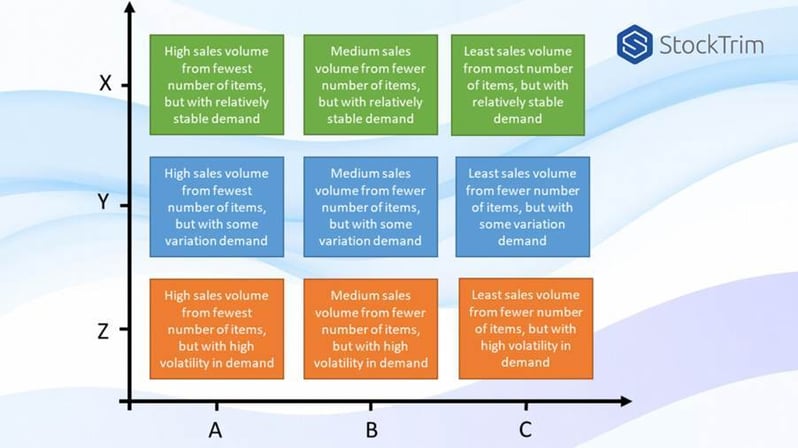
However, revenue should not be your only criterion.
Imagine two SKUs:
SKU A: Sells 1,000 units per month and has a two-day supplier lead time.
SKU B: Sells 50 units per month but has a six-month supplier lead time and is required to manufacture your flagship product.
SKU B may be more critical from a supply risk perspective even though its sales volume is much lower.
What should you configure for critical SKUs?
For your most important products, make sure the forecasting system has accurate information about:
- Historical demand
- Current stock
- Lead time
- Minimum order quantity
- Order multiples
- Safety stock requirements
- Product lifecycle
- Seasonal patterns
- Supplier constraints
This gives the system the context it needs to turn a demand forecast into a useful inventory recommendation.
Step 6: Configure Safety Stock and Lead Times
A demand forecast tells you what you expect to sell.
It does not, by itself, tell you how much inventory you should hold.
Your inventory plan also needs to consider uncertainty.
For example:
Forecast demand = 500 units
That doesn't automatically mean you should order exactly 500 units.
Your required inventory may also depend on:
- Demand variability
- Supplier lead time
- Supplier reliability
- Desired service level
- Current inventory
- Inventory already on order
This is where safety stock becomes important.
Safety stock is additional inventory held to protect against uncertainty in demand or supply.
An automated planning tool can help calculate or recommend appropriate safety stock rather than requiring planners to manually maintain formulas across hundreds of spreadsheets.
Lead time is equally important.
If a supplier takes eight weeks to deliver, the system needs to consider expected demand during that replenishment period when determining when and how much to order.
Step 7: Run Automated Forecasts Alongside Your Manual Forecast
For the first few planning cycles, compare the automated forecast with your existing manual forecast.
|
Compare |
Why it matters |
|
Automated forecast vs. manual forecast |
Understand differences |
|
Forecast vs. actual demand |
Assess forecast performance |
|
Recommended orders vs. manual orders |
Validate replenishment logic |
|
Projected stock vs. actual stock |
Identify inventory planning gaps |
|
Stock-outs vs. previous periods |
Measure availability improvements |
Step 8: Move From Manal Forecasting to Exception-Based Planning
This is where automation can fundamentally change the role of a demand planner.
With a manual process, planners often review every SKU.
With an automated process, the system can calculate forecasts across the product range and highlight the products that require attention.
For example:
- Demand has increased sharply
- A stock-out is projected
- Inventory is significantly above expected demand
- Forecast demand has changed
- Supplier lead time has increased
- A product is becoming slow-moving
- A replenishment recommendation looks unusual
Automation handles the repetitive calculations. The planner focuses on exceptions and decisions.
Step 9: Extend Forecasting to Components and Raw Materials
If you are a manufacturer, automating finished-goods forecasting may only solve part of the problem.
Consider a finished product that requires:
- 1 motor
- 1 casing
- 2 circuit boards
- 4 screws
If the forecast says you need to produce 500 finished units, you also need to know how much of each component is required.
This is where multi-level Bill of Materials (BOM) forecasting becomes especially handy.
An automated manufacturing planning process can work backwards from finished-goods demand:
Finished-goods forecast → production requirement → BOM explosion → component requirements → raw-material requirements
This allows demand planning to extend beyond finished products into the components needed to make them.
For manufacturers, this can be particularly useful when a shortage of one low-volume component can prevent an otherwise well-stocked finished product from being produced.
Step 10: Measure the Results
Once automation is running, measure whether it is actually improving your planning process.
Useful metrics include:
Forecast accuracy
How closely does predicted demand match actual demand?
Stock-out rate
How often are customers unable to purchase products because inventory is unavailable?
Excess inventory
How much inventory is being held beyond what is reasonably required?
Inventory turnover
How efficiently is inventory being converted into sales?
Service level
How consistently can you fulfil customer demand?
Planner time
How much time does the team spend preparing forecasts versus reviewing and acting on them?
If automation reduces a planner's weekly spreadsheet work from 15 hours to 3 hours, those 12 hours can be redirected toward supplier management, inventory analysis, scenario planning and other higher-value activities.
How StockTrim Automates Manual Forecasting
StockTrim is designed to help SMBs move from spreadsheet-based inventory forecasting to an automated workflow.
Rather than requiring planners to manually calculate forecasts for individual products, StockTrim uses historical sales and inventory data to generate demand forecasts and inventory recommendations across SKUs.
Connect your data → generate forecasts → calculate inventory requirements → review recommendations → act on exceptions.
StockTrim can integrate with business systems so that sales and inventory data does not need to be manually rebuilt in a forecasting spreadsheet for every planning cycle.
It also provides planning capabilities such as:
- Demand forecasting
- Dynamic safety stock
- Inventory recommendations
- Scenario planning
- Multiple forecasting horizons
- SKU-level planning
- Multi-account inventory planning
- Multi-level BOM forecasting for manufacturers
The important distinction is that the software does not replace the planning process.
It provides the calculations and recommendations that planners can use to make better inventory decisions.
How to Get Started With StockTrim
If you are currently forecasting manually, you don't need to automate your entire inventory operation overnight.
A practical starting point is:
1. Connect your data
Bring your sales and inventory information into the platform.
2. Review your SKU data
Check that your products, sales history and inventory information are correctly represented.
3. Identify your critical SKUs
Start by paying particular attention to your high-impact, high-risk or frequently stocked-out products.
4. Review the forecasts
Look at how the system interprets your historical demand patterns.
5. Check the inventory recommendations
Compare recommended inventory levels and replenishment quantities with your existing planning process.
6. Validate
Run the automated process alongside your existing manual forecast until your team is comfortable with the results.
7. Expand
Once the process is working well, gradually extend automated forecasting across your wider SKU range.
This phased approach makes automation less disruptive and gives planners time to understand how the system fits into their existing workflow.
Common Mistakes When Automating Demand Forecasting
1. Automating bad data
If your historical sales or inventory data is unreliable, automation can simply make unreliable calculations faster.
2. Trying to automate every SKU immediately
Start with critical SKUs, validate the process, and expand gradually.
3. Looking only at forecast accuracy
A forecast can be accurate while inventory is still too high or too low. Consider the entire planning process.
4. Ignoring lead times
Demand forecasts need to be translated into replenishment decisions using realistic supplier lead times.
5. Treating safety stock as a fixed number
Demand and supply conditions change. Safety stock should reflect the level of uncertainty and service required.
6. Removing human judgement
Automated forecasts cannot know about every upcoming promotion, customer change or business decision.
7. Buying software without changing the process
Simply purchasing forecasting software will not automatically eliminate manual work.
Your team needs to establish how forecasts are reviewed, how exceptions are handled and who makes the final inventory decisions.
From Spreadsheet Forecasting to Automated Inventory Planning
Moving away from manual forecasting does not have to mean throwing away everything your team currently does.
A better approach is to automate the repetitive parts of the process while retaining human judgement where it matters most.
For SMBs, this approach can provide a practical path toward more scalable demand planning without requiring a large planning team or a complicated forecasting infrastructure.
About StockTrim
StockTrim is the leading inventory forecasting software built for small to medium sized businesses. Since 2017, it has worked with thousands of business datasets to provide data-backed inventory foresights. It integrates natively with multiple systems, with no data migration required, and no disruption to your workflow.
Start your free 14-day trial and receive data-backed foresights in minutes.