


Running a small manufacturing, wholesale, e-commerce, or retail business means constantly walking a tightrope: order too much stock and your cash is stuck on a shelf; order too little, and you're turning away customers. Most businesses solve this with spreadsheets and gut feel. That's the problem.
The businesses that get it right have one thing in common: strong demand forecasting accuracy. When you can predict what customers will actually buy, everything downstream gets easier: purchasing, cash flow, storage, staffing.
This article covers what drives demand forecasting accuracy, how to find your optimal inventory level for every product, and how planning software helps you get there faster than manual methods ever could.
What Is Demand Forecasting Accuracy?
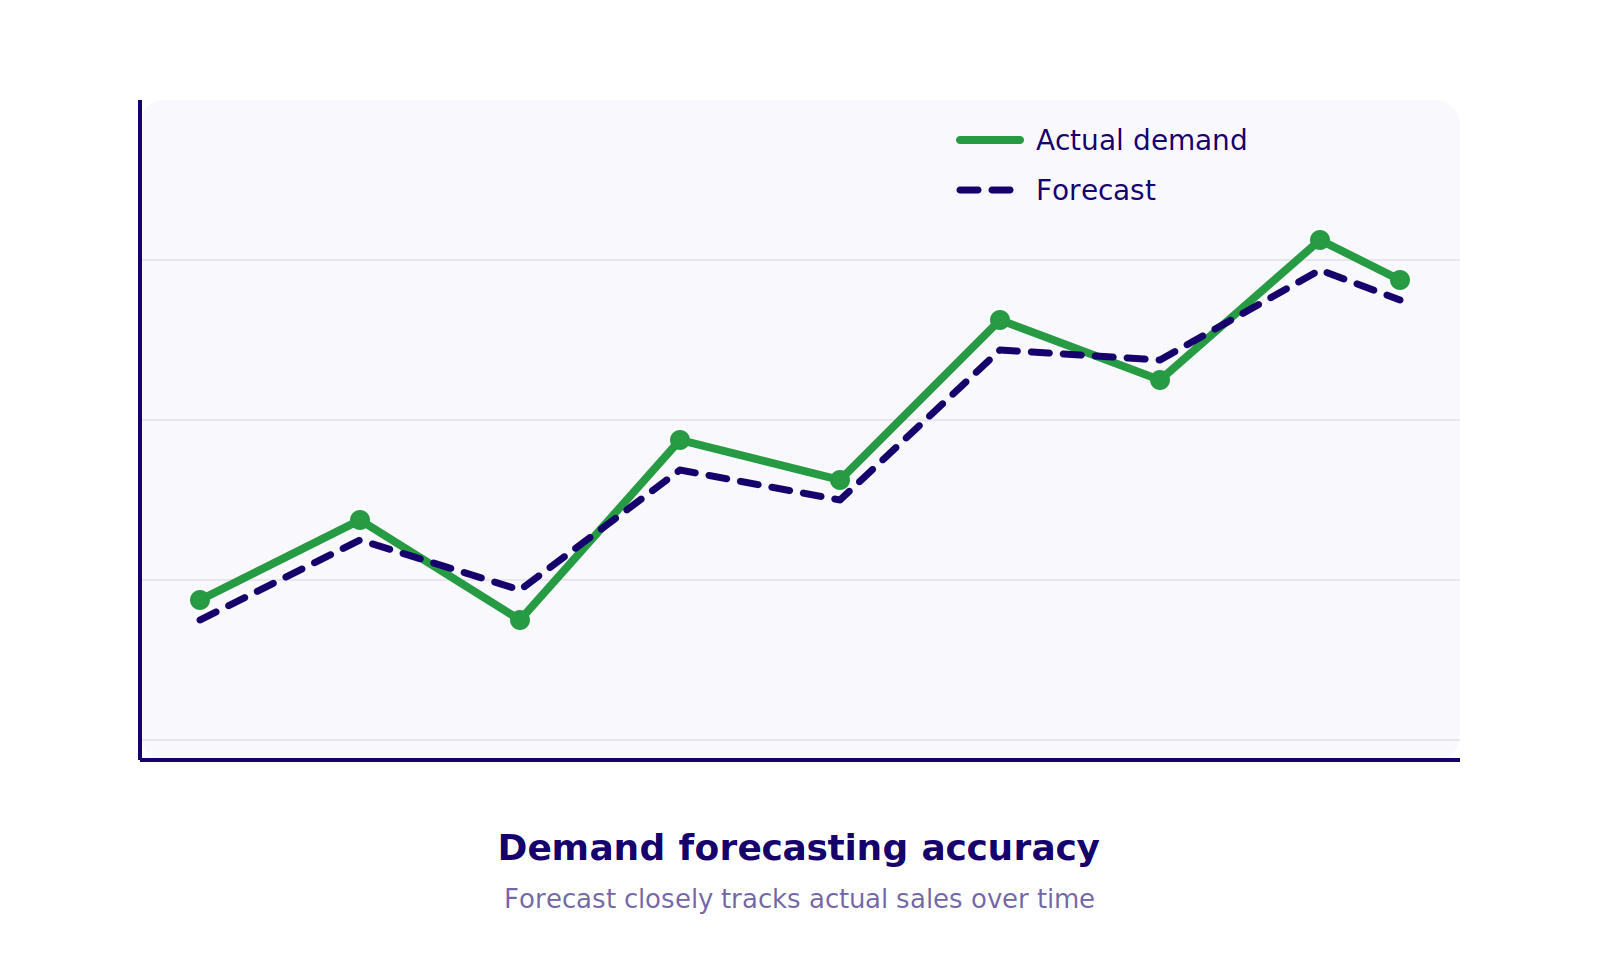
Demand forecasting accuracy measures how closely your predicted sales match what actually sells. It's usually tracked using a metric like MAPE (Mean Absolute Percentage Error): the lower the error, the more accurate the forecast.
Why it matters: every inventory decision you make (how much to order, when to reorder, how much safety stock to hold) is only as good as the forecast behind it. A forecast that's off by 30% doesn't just create a paperwork problem. It creates real stockouts, real overstock, and real cash tied up in the wrong products.
Small businesses often struggle with demand forecasting accuracy because they're working from:
-
Basic spreadsheet formulas that can't account for seasonality or trends
-
Gut instinct built on last month's sales, not real demand patterns
-
No visibility into lead times or supplier variability
-
Manual processes that don't scale past a few hundred SKUs
See how StockTrims plans work.
What Is an Optimal Inventory Level?
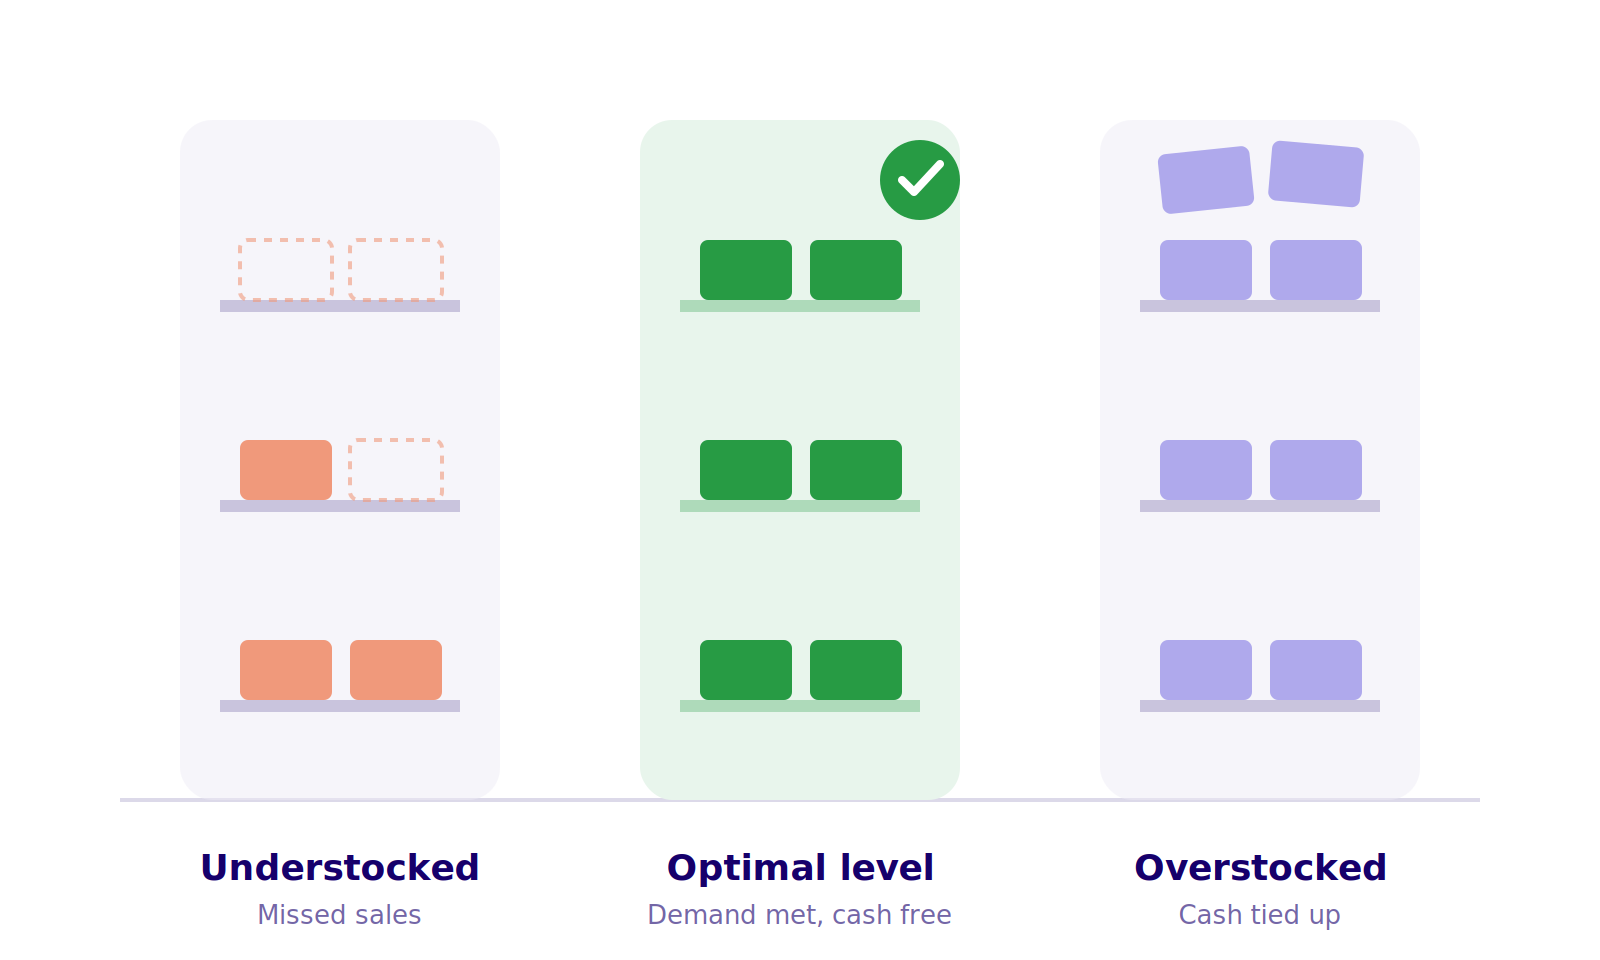
Your optimal inventory level is the sweet spot where you have enough stock to meet demand without tying up excess cash or warehouse space. It's different for every product, and it shifts constantly based on:
-
Sales velocity and seasonality
-
Supplier lead times
-
Minimum order quantities
-
Storage costs and capacity
-
Upcoming promotions or campaigns
Get it right, and you free up cash, cut storage costs, and stop losing sales to stockouts. Get it wrong in either direction, and it costs you: too much stock drains cash flow, too little costs you customers who go elsewhere.
There's no universal rule for how much of your capital should sit in inventory. It depends on your margins, your industry, and how predictable your demand is. The safest way to check is your inventory turnover rate: how many times you sell through and replace your stock in a given period. A low turnover rate is usually a sign that too much cash is sitting on shelves instead of working for your business.
Why Manual Inventory Planning Falls Short
Most small businesses start with spreadsheets, and that's fine at a small scale. But as product lines grow, spreadsheets break down fast:
-
They don't adjust for seasonality. A flat reorder formula treats December the same as June.
-
They don't account for lead time variability. If your supplier's delivery times shift, your spreadsheet doesn't know.
-
They're slow to update. By the time someone manually recalculates reorder points, the data's already stale.
-
They don't scale. Adding SKUs means adding more manual work, not less.
This is where inventory planning software earns its keep.
Excel isn't the enemy here. It's genuinely fine for a handful of products with steady, predictable demand. The problem shows up as you grow: more SKUs, more suppliers, more seasonal swings. That's the point where manual recalculation stops being a minor chore and starts costing you real accuracy, and it's usually the signal that it's time to move to dedicated planning software.
Forecasting Demand for New Products
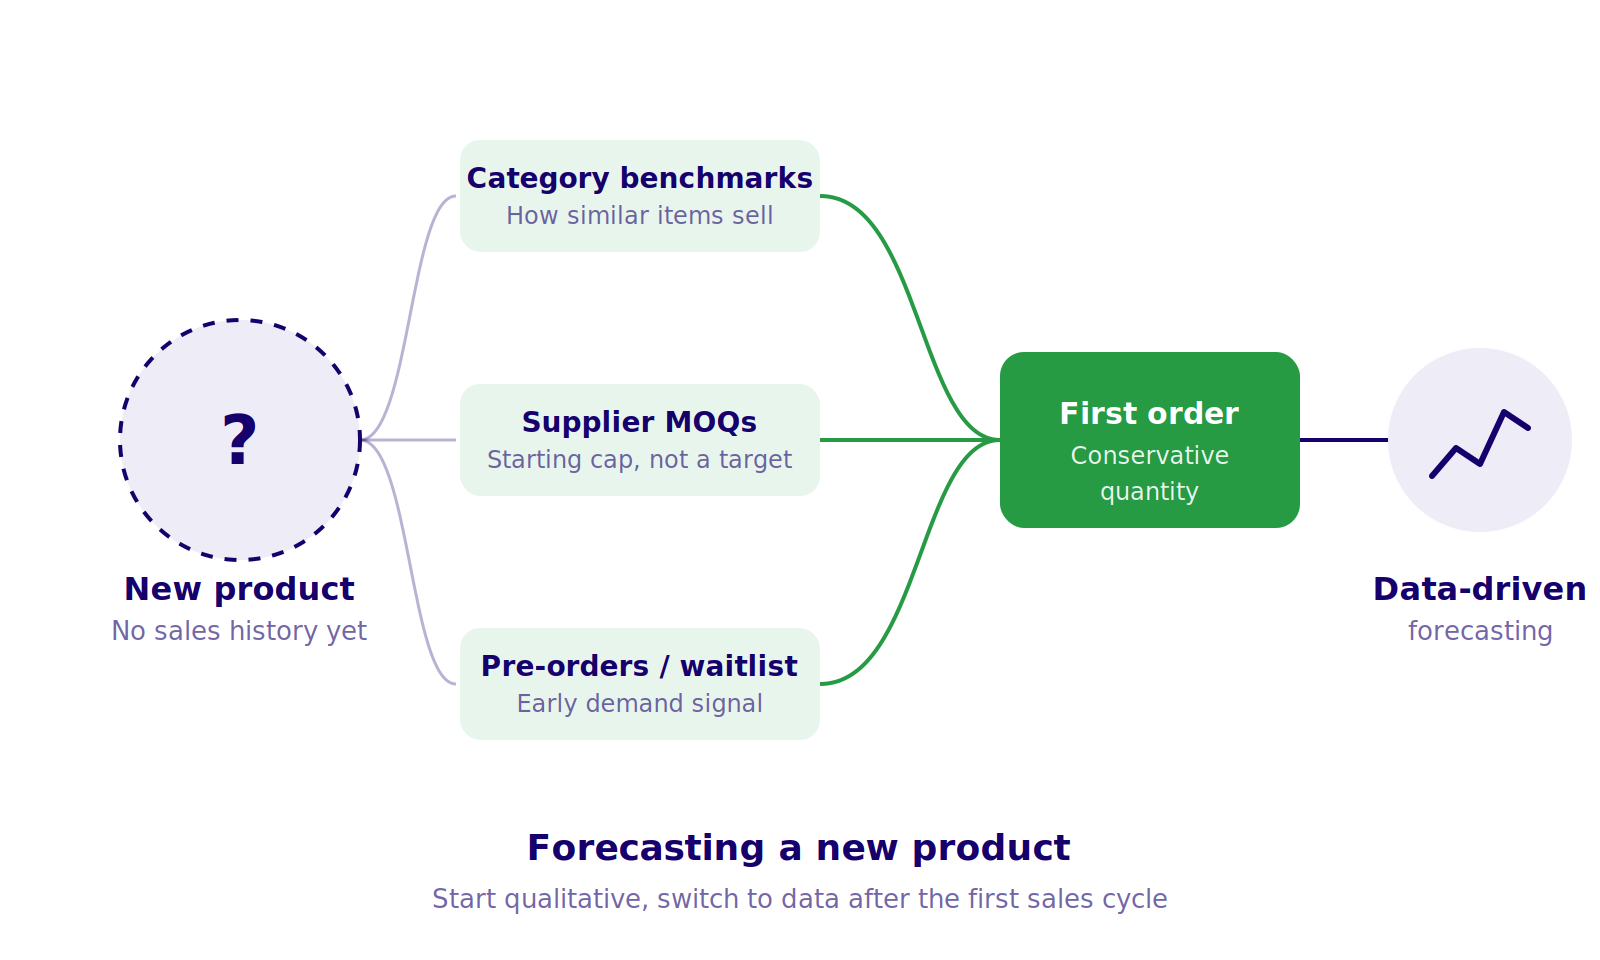
Every product starts with zero sales history, which makes forecasting genuinely hard in the early days. Without past data to lean on, the safest approach is qualitative:
-
Look at how similar products in your category typically sell
-
Use supplier minimum order quantities as a starting cap, not a target
-
Factor in any pre-orders, waitlist signups, or early customer interest you've already collected
-
Order conservatively for the first cycle rather than betting big on a guess
Once you've got a few weeks of real sales data, shift over to data-driven forecasting. That first sales cycle is your most valuable input: it replaces guesswork with actual demand signals for everything that follows.
How Inventory Planning Software Improves Forecasting and Stock Levels
1. Better Demand Forecasting Accuracy
Planning software uses historical sales data, trends, and seasonality patterns to build forecasts that update automatically. Instead of a static formula, you get a forecast that adjusts as your sales data changes, which directly improves demand forecasting accuracy over time.
2. Finding Your Optimal Inventory Level, Product by Product
Rather than applying one reorder rule across your entire catalog, good software calculates the optimal inventory level for each SKU individually, factoring in lead times, supplier schedules, seasonal demand, and planned promotions.
3. Smarter Storage Allocation
For businesses running multiple warehouses or fulfillment centers, planning software shows you where each product should sit based on sales volume and shipping destinations. That means lower shipping costs and faster order fulfillment.
4. Lower Carrying Costs
By flagging slow-moving stock early and keeping fast-sellers appropriately stocked, planning software helps you cut the costs tied up in storage, warehousing, and excess inventory.
5. Less Manual Work, Fewer Errors
Automating demand forecasting and reorder calculations removes the spreadsheet busywork and the errors that come with it, freeing your team to focus on decisions instead of data entry.
6. Real-Time Visibility
Instead of waiting for a monthly report, you get live dashboards showing current stock levels, demand shifts, and supply chain issues as they happen, so you can react before a stockout hits.
7. One Source of Truth Across Teams
When sales, operations, and procurement are all working off the same forecast and stock data, there's less back-and-forth and fewer costly miscommunications. Integration with your CRM or ERP keeps everyone aligned.
8. Room to Grow
As your product catalog expands or you enter new markets, planning software scales with you. You don't need to hire more people just to keep up with more SKUs.
The Bottom Line
Improving demand forecasting accuracy and consistently hitting your optimal inventory level isn't about working harder in your spreadsheets. It's about using a system built to handle the variables spreadsheets can't: seasonality, lead times, supplier changes, and growth.
Small businesses that make this shift see fewer stockouts, less cash tied up in excess stock, and more time back for actual strategy instead of manual recalculating.
FAQ: Inventory Planning and Demand Forecasting
What is demand forecasting accuracy?
Demand forecasting accuracy measures how closely predicted sales match actual sales, typically tracked with an error metric like MAPE. Higher accuracy means better purchasing decisions and fewer stockouts or overstock situations.
How do you calculate optimal inventory level?
Optimal inventory level is calculated by factoring in expected demand, supplier lead times, safety stock needs, and reorder frequency for each individual product. It's not a single number for your whole catalog; it changes SKU by SKU.
Why does demand forecasting accuracy matter for small businesses?
Small businesses run on tighter cash flow than large enterprises, so an inaccurate forecast has an outsized impact. Overstocking ties up cash you need elsewhere; understocking loses sales you can't easily win back.
Can spreadsheets calculate optimal inventory levels accurately?
Spreadsheets can work at a small scale, but they typically use static formulas that don't adjust for seasonality, lead time changes, or growing SKU counts. As a business scales, spreadsheets tend to fall behind real demand patterns.
What's the difference between safety stock and optimal inventory level?
Safety stock is the buffer held to cover unexpected demand spikes or supply delays. Optimal inventory level is the broader target that includes safety stock plus the regular stock needed to meet expected demand until the next reorder.
How do you forecast demand for a new product with no sales history?
Without historical data, start with qualitative methods: competitor benchmarks, industry averages, supplier minimums, and pre-order or waitlist numbers if you have them. Order conservatively for the first cycle, then switch to data-driven forecasting as soon as you have a few weeks of real sales to work from.
Is Excel good enough for inventory forecasting, or do I need software?
Excel can work for a handful of SKUs with stable demand. Once you're managing seasonality, multiple suppliers, or more than a few dozen products, spreadsheets tend to fall behind because they don't update automatically or adjust for changing lead times. That's usually the point where dedicated forecasting software pays for itself.
How much of my capital should I put into inventory?
There's no universal number; it depends on your industry, margins, and cash flow needs. As a general guide, hold enough stock to cover demand through your next reliable reorder cycle, plus a safety buffer, without tying up so much cash that you can't cover other expenses. Tracking your inventory turnover rate is the best way to tell if you're overcommitting capital to stock.
Start a 14-day free trial today.